By Steve Neavling
Motor City Muckraker
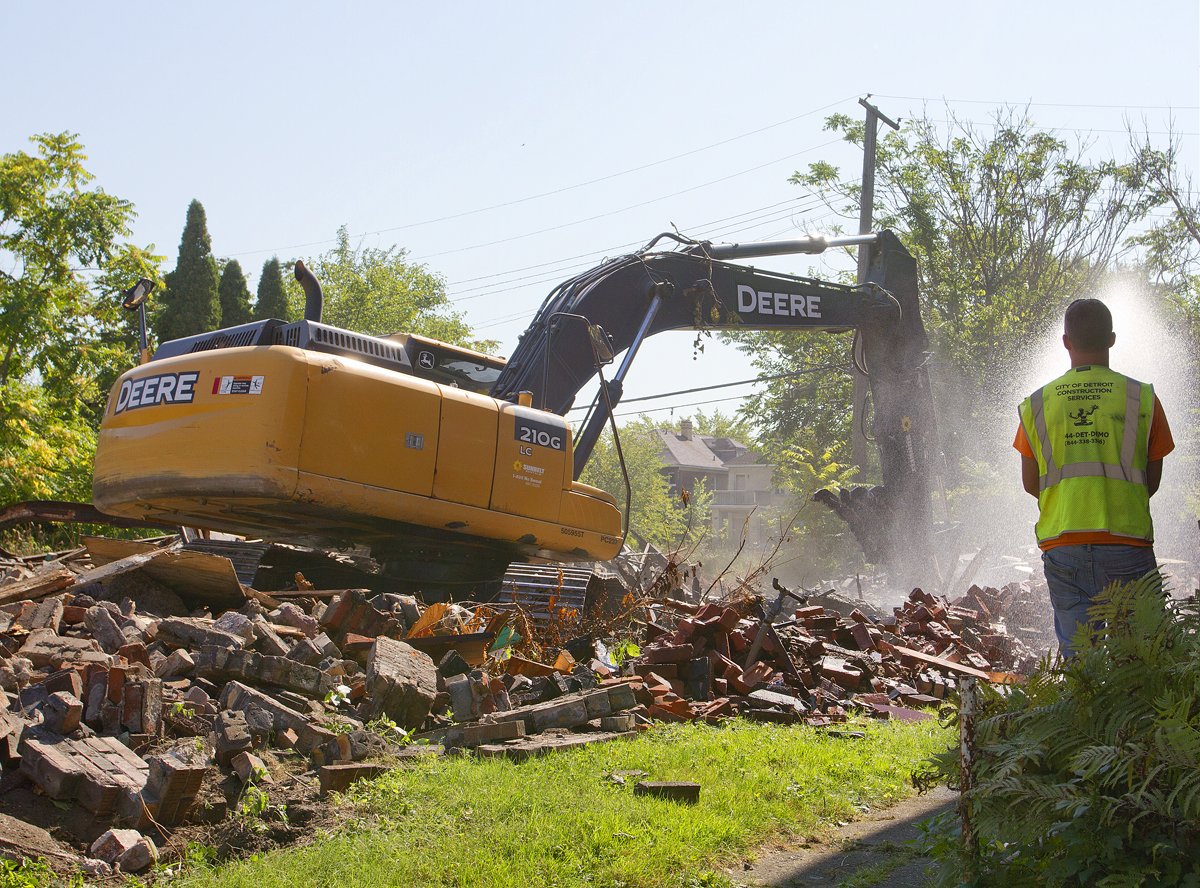
The city of Detroit released an impressive interactive map and database that show all 7,740 demolitions, how much each cost and who received the contracts since Mayor Mike Duggan took office in January 2014.
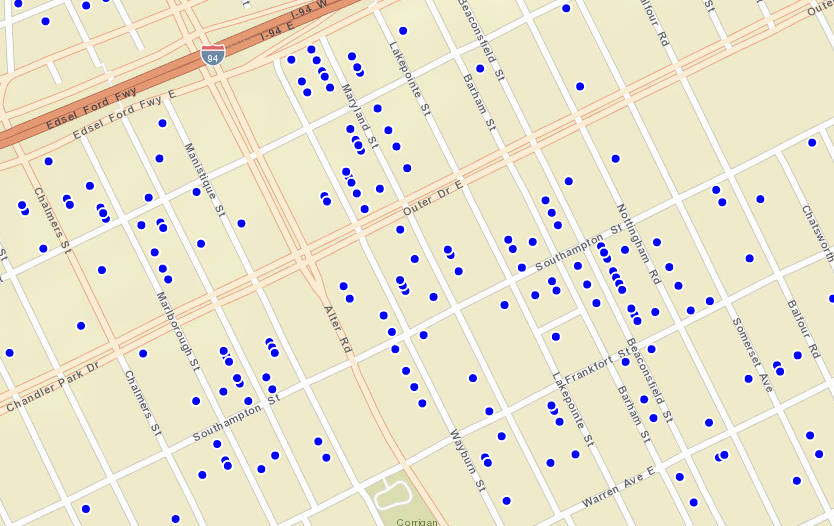
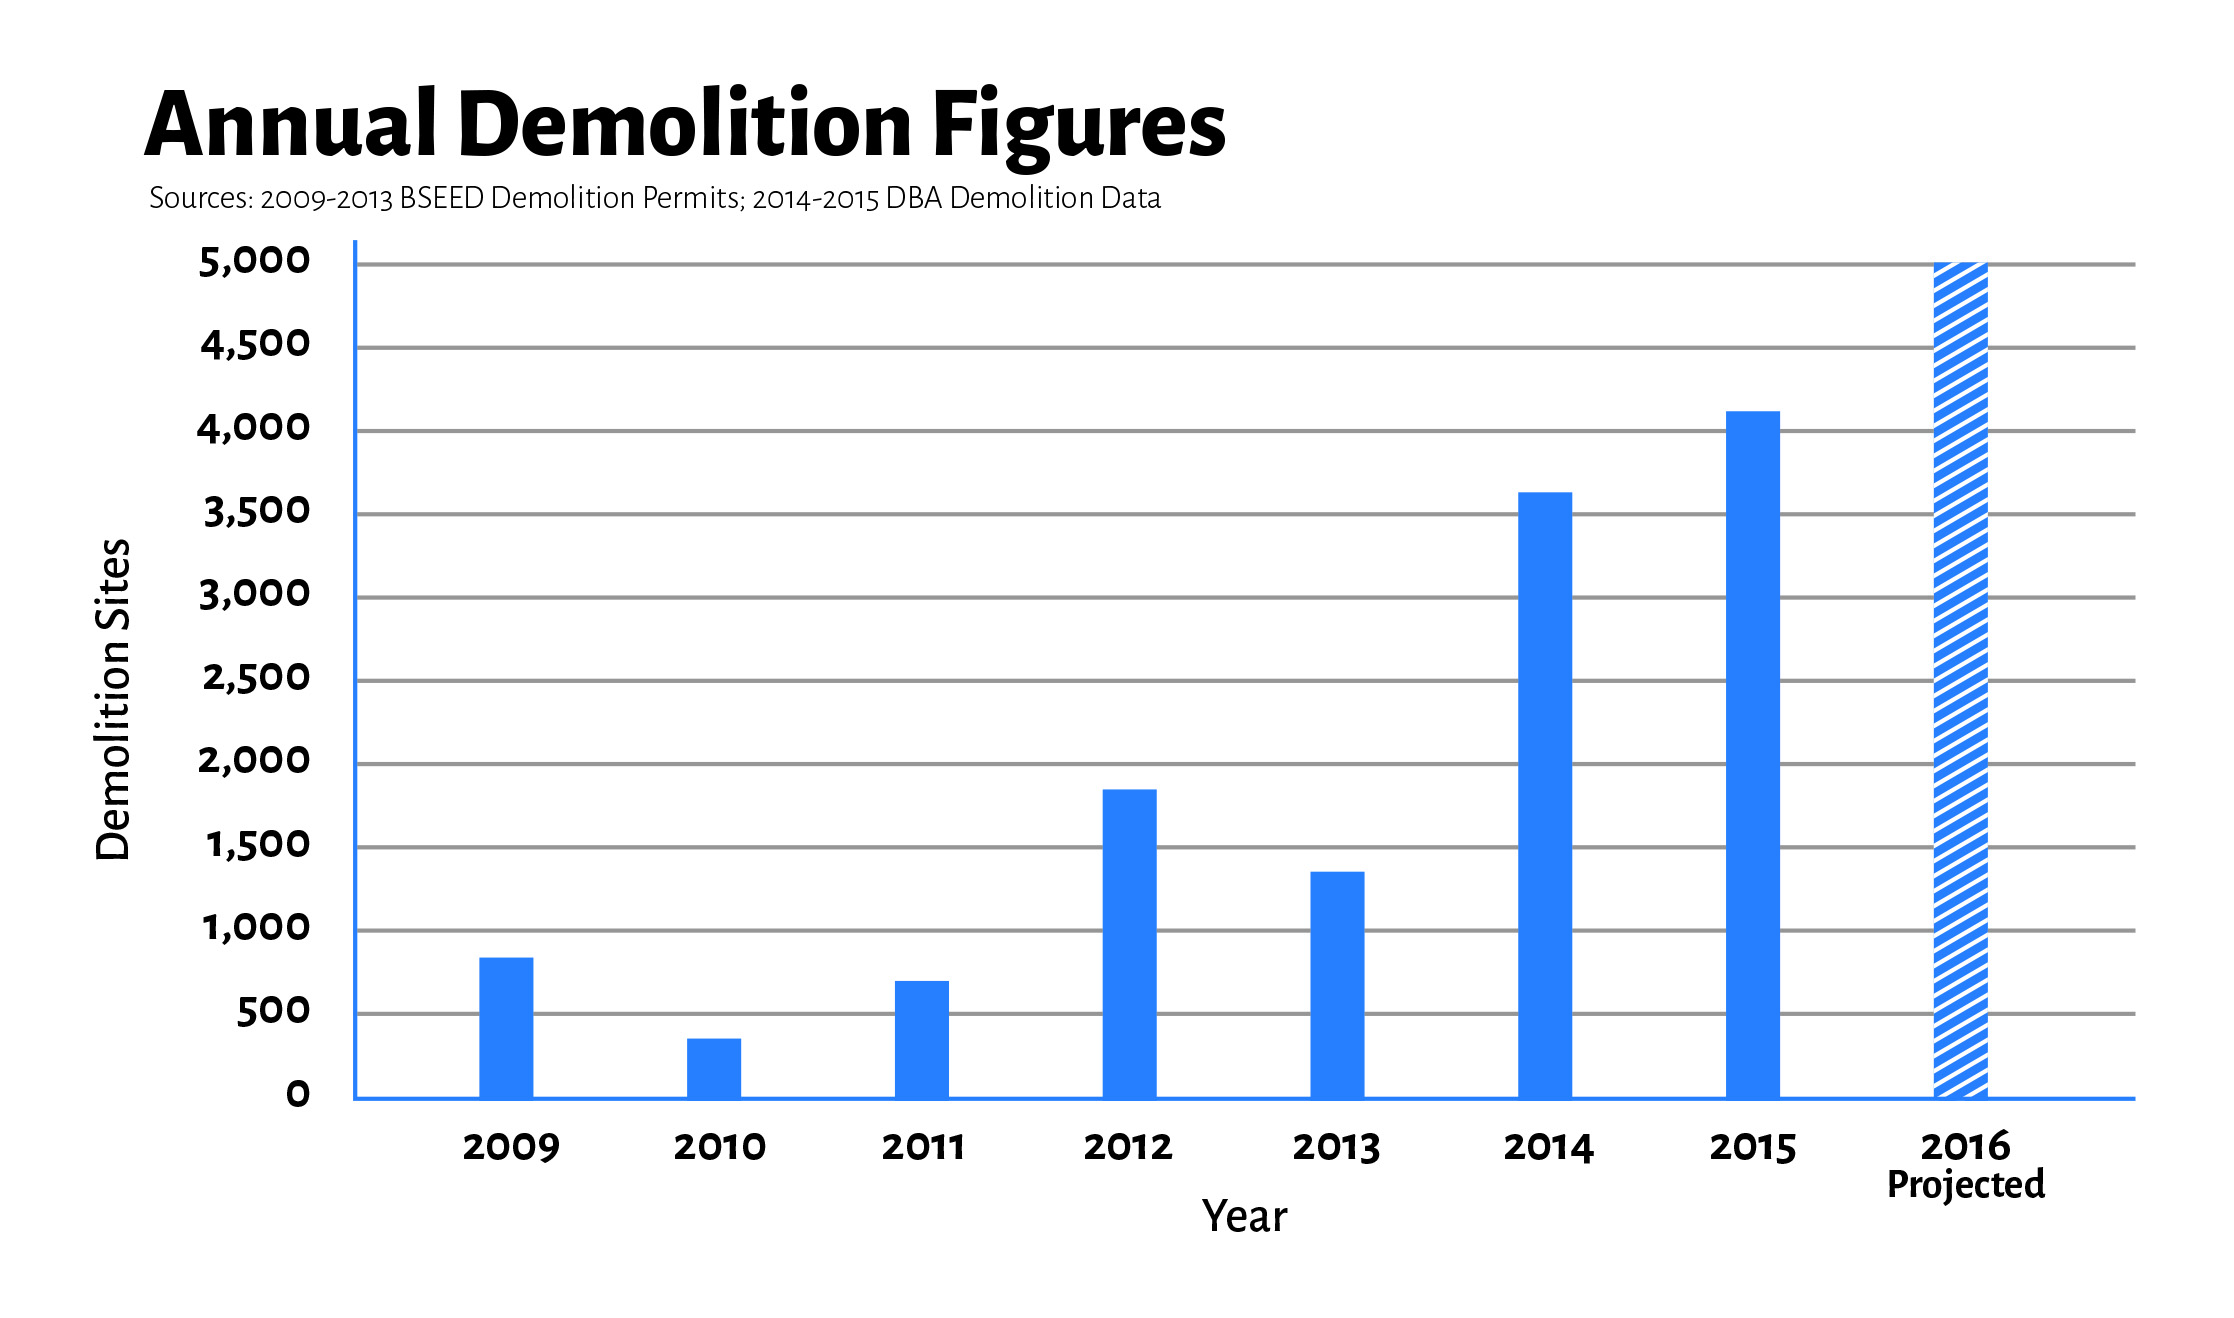
The map shows the breadth of the unprecedented number of demolitions in Detroit’s neighborhoods that were hardest hit by foreclosures following the economic downturn that sent home prices plummeting.
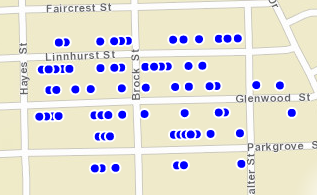
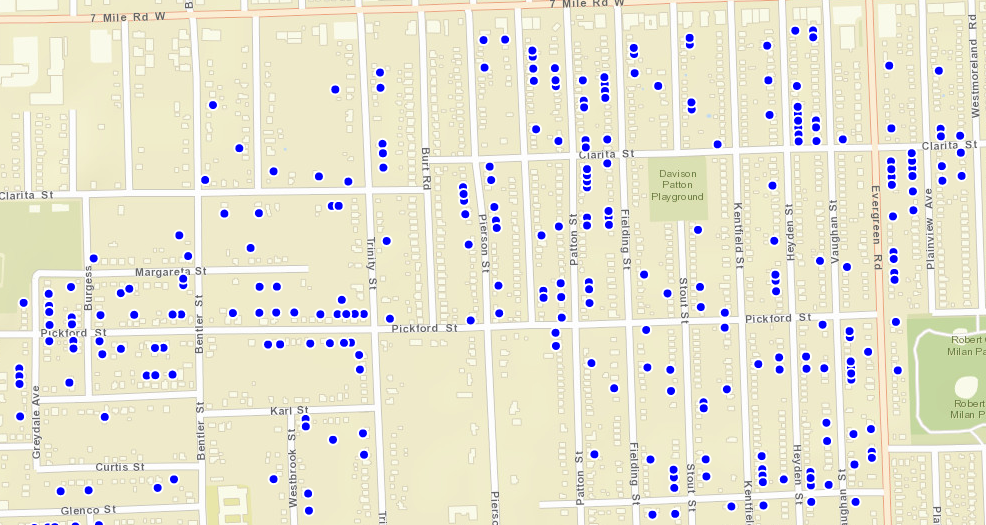
On some blocks, 10 or more houses have been demolished as the city aggressively tackles blight that has spread like cancer across Detroit’s neighborhoods.
“We are committed to running a program that is operationally transparent,” Brian Farkas, special projects manager for the Detroit Building Authority, told me. “We want to show the city, the state and the country what we are doing.”
Here’s a sampling of the areas with a lot of demolitions:
The interactive site also includes a sortable database of every demolition, the cost for each one, the contractor and the address and date of every razed house and commercial building.
The costs varied from $1,950 to demolish a small house on the west side to $367,000 to raze the abandoned Garvey K-8 school on the east side. The average cost to demolish a house was $13,908, according to an analysis of the data.
Here are the five companies that demolished the most houses and commercial buildings.
Demolitions slowed considerably in the fall of 2014, largely because of funding issues and the limited number of equipment for companies to knock down the houses, haul off the debris and bring in dirt to fill in the holes, city officials said.
“By the end of 2017, we’ll have 20,000 homes down,” Duggan pledged during the State of the City this week.
The average cost of demolitions increased 26.2% – from $11,363 to $15,391 – between the summer of 2014 and the summer of 2015. So far in January and February 2016, the average cost dipped slightly to $14,996.
“A majority of the demolitions were bid out, so the (price of demolitions) is an accurate reflection of the market at the time,” Farkas told me.
Despite the demolition slowdown, the city is razing far more houses and commercial buildings than any past administration, largely because of federal funding from President Obama’s administration and the aggressive campaign by the Detroit Land Bank to eliminate blight.
City officials believe the rapid pace of the demolitions is why arson fires continue to decline because there are fewer houses to burn down.
The map and data will be updated at least once a week, Farkas said.
Steve Neavling
Steve Neavling lives and works in Detroit as an investigative journalist. His stories have uncovered corruption, led to arrests and reforms and prompted FBI investigations.



14 Responses to "Interactive map: Everything you wanted to know about Detroit’s 7,740 demolitions"